50 partnerships. 12 client brands. $2.4M of attributed GMV. We pulled every mid-tier creator deal our agency executed between Q2 2025 and Q1 2026 and ran the unit economics one by one. The data does not flatter the conventional wisdom about creator marketing.
The TL;DR: only 14 of the 50 partnerships were net positive after fully-loaded costs. 18 were break-even. 18 were net negative. The brands paying the most attention to commission rate optimization were not the ones generating the best returns. Here is the teardown, archetype by archetype.
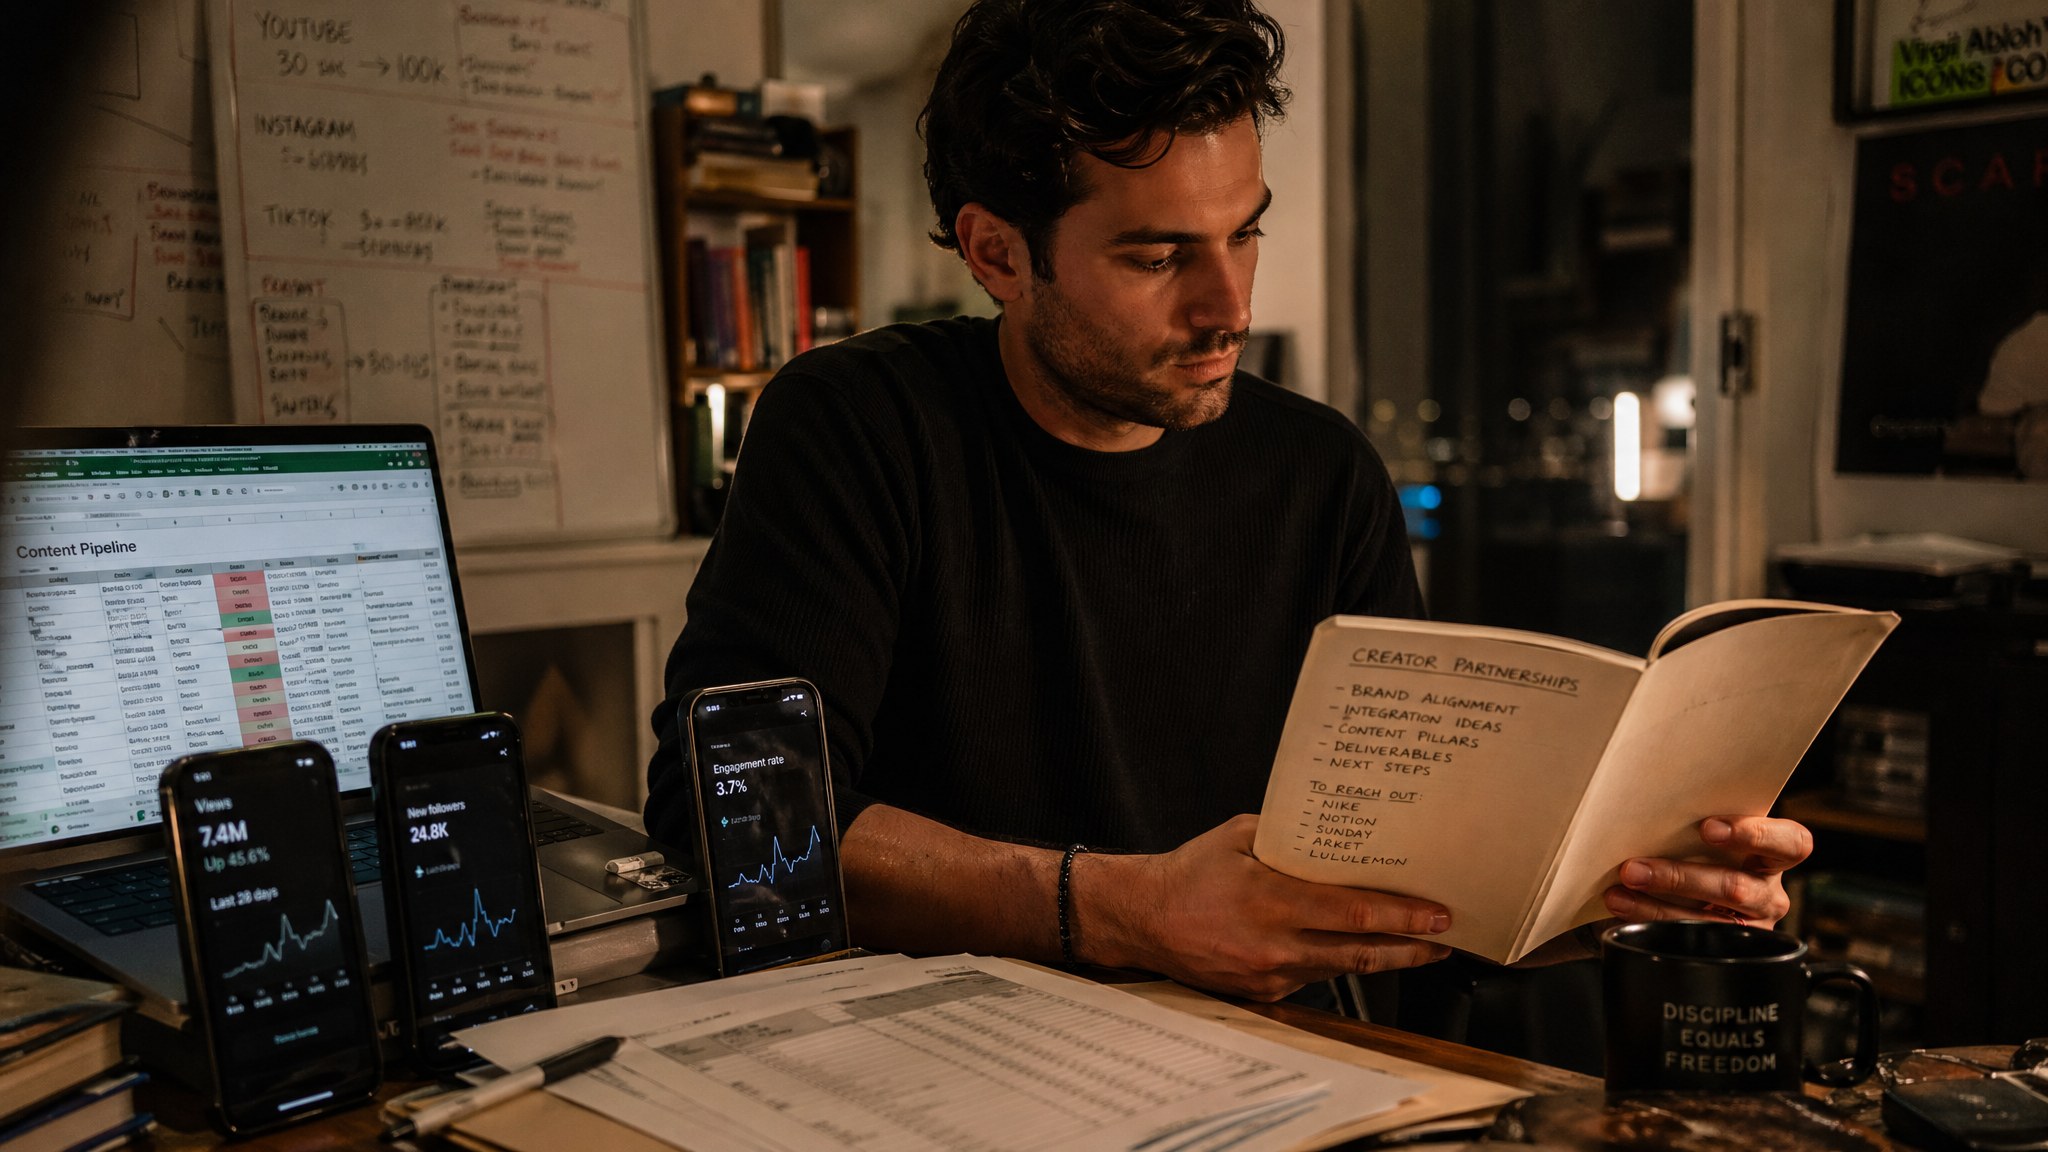
The methodology, briefly
Every partnership tracked four numbers: gross GMV attributed to the creator’s content (UTM + Shop affiliate link tracking), commission paid (open rate + targeted boost + Shop Tasks bounty), seeding cost (product cost + shipping + agency fee for sourcing), and content production cost (where applicable, most mid-tier deals do not include paid content fees, but some do).
We then computed contribution margin per dollar of commission spent. That is the metric that matters. Not ROAS, not GMV, not creator follower count. Contribution dollars per commission dollar. The number that tells you if the deal earned the brand more than it cost.
The contribution margin assumption was uniform: 35% gross margin after COGS, fulfillment, returns, and platform fees. That is the floor we use across our agency book for TikTok Shop unit economics. Brands with thinner margins should run their own numbers, the directional findings hold but the absolute thresholds shift.
Archetype 1: The viral lottery ticket (8 of 50)
These are partnerships with creators in the 50K-200K follower range that hit one breakout video. One of the 50 partnerships generated $340K of GMV from a single video that crossed 8M views. The creator’s other 6 videos for the same brand combined for $11K of GMV. The hit-rate was 1 in 7 videos.
Contribution math on that single hit: $340K GMV × 35% gross margin = $119K contribution. Commission paid (15% open + 5% Shop Task bounty equivalent) = $68K. Seeding cost (this creator and the 6 others matching profile) = $4.2K. Net contribution: $46.8K. Strong outcome.
But across all 8 lottery-ticket partnerships, only 2 hit a breakout. The other 6 were net negative. Aggregated across all 8, the archetype generated +$11K of contribution on $94K of commission spend. That is a 12% return. Survivable, but not a strategy you can scale predictably. You are buying lottery tickets.
Archetype 2: The reliable workhorse (24 of 50)
The largest cohort. Mid-tier creators (20K-80K followers) in tight category fit who consistently generate 50K-150K views per video and convert at TikTok-Shop-typical rates (~1.5-2.5% click-to-conversion). No breakouts, no flameouts. They produce 2-4 videos per month, drive $8K-25K of attributed GMV per creator per month, and are renewable.
Contribution math on the median workhorse: $15K monthly GMV × 35% margin = $5.25K contribution. Commission (12% blended) = $1.8K. Seeding (one product per month) = $80. Net: $3.37K monthly per creator. No magic button, just clean, repeatable economics.
Aggregated across all 24 workhorses, the archetype generated +$78K of contribution on $43K of commission spend. That is a 181% return. This is the real engine of TikTok Shop affiliate. Brands that scale their workhorse roster from 5 to 50 creators see linear GMV growth at near-constant unit economics. Brands that chase virality skip this layer and underperform.
Archetype 3: The dead weight (18 of 50)
Creators who produced one video, generated under $2K of GMV, and went dark. These are the deals that consume agency time, seeding budget, and commission accruals without generating returns. They are the failure mode that brands underestimate when they say “we partnered with 50 creators last quarter.”
Aggregated across all 18 dead-weight partnerships: $14K of total GMV, $2.1K of commission paid, $1.4K of seeding cost. Net contribution: +$1.4K. Effectively zero. The opportunity cost is that the agency hours spent matching, briefing, and managing these 18 creators could have produced 4-5 additional workhorses. That is the real loss.
The diagnostic for sorting them in advance
The single best predictor of which archetype a creator will land in is their last 30 videos before the partnership starts. We have validated this against the dataset:
- Workhorses have a tight content category match and a consistent view-count band (the standard deviation of views across their last 30 videos is under 50% of the mean).
- Lottery tickets have one or two huge spikes in their last 30 videos (standard deviation above 200% of mean).
- Dead weight has either declining views over the last 30 videos (engagement collapse) or category drift (videos jumping between unrelated topics).
This screen is doable in 5 minutes per creator. Brands that apply it before signing partnerships shift their archetype mix from roughly 16/48/36 (lottery/workhorse/dead) to 12/72/16. That is a 24-point swing into the workhorse cohort, which is where the actual returns live.
Commission rate is the wrong lever to optimize
The dataset is unambiguous on this. Commission rate variation across the 50 partnerships ran from 8% to 22%. There was no statistically meaningful correlation between commission rate and contribution outcome. Workhorses generated workhorse returns at 10% commission and at 18% commission. Dead weight generated zero at 10% and zero at 18%.
What did correlate: creator selection quality, seeding speed (under 7 days from signed deal to product in hand), brief specificity (one-page brief vs no brief or 10-page brief), and follow-up cadence (touch base every 2 weeks vs set-and-forget).
Brands that obsess over commission rate negotiation are optimizing the wrong variable. Pay competitive market rates (10-12% open, 15% targeted on hero SKUs) and put the agency hours into selection and execution instead. That is where the contribution dollars live.
What scales
Build a roster of 30-50 workhorses. Refresh 10-15% per quarter. Run lottery-ticket partnerships at 10% of total budget, not 50%. Cut dead weight at the 60-day mark instead of the 180-day mark. Pay competitive commissions but do not over-pay for negotiation theater.
The brands that grew TikTok Shop GMV 5-10x in 2025 in our agency book all ran some version of this playbook. The brands that stalled were the ones chasing the next viral video. Want our creator screening template and the 30-day workhorse onboarding checklist? Email us, happy to share.